Top Metrics for Measuring LTL Automation ROI
Measure freight, labor, OTD, transit variability, invoice accuracy, detention, and customer metrics to quantify LTL automation ROI.
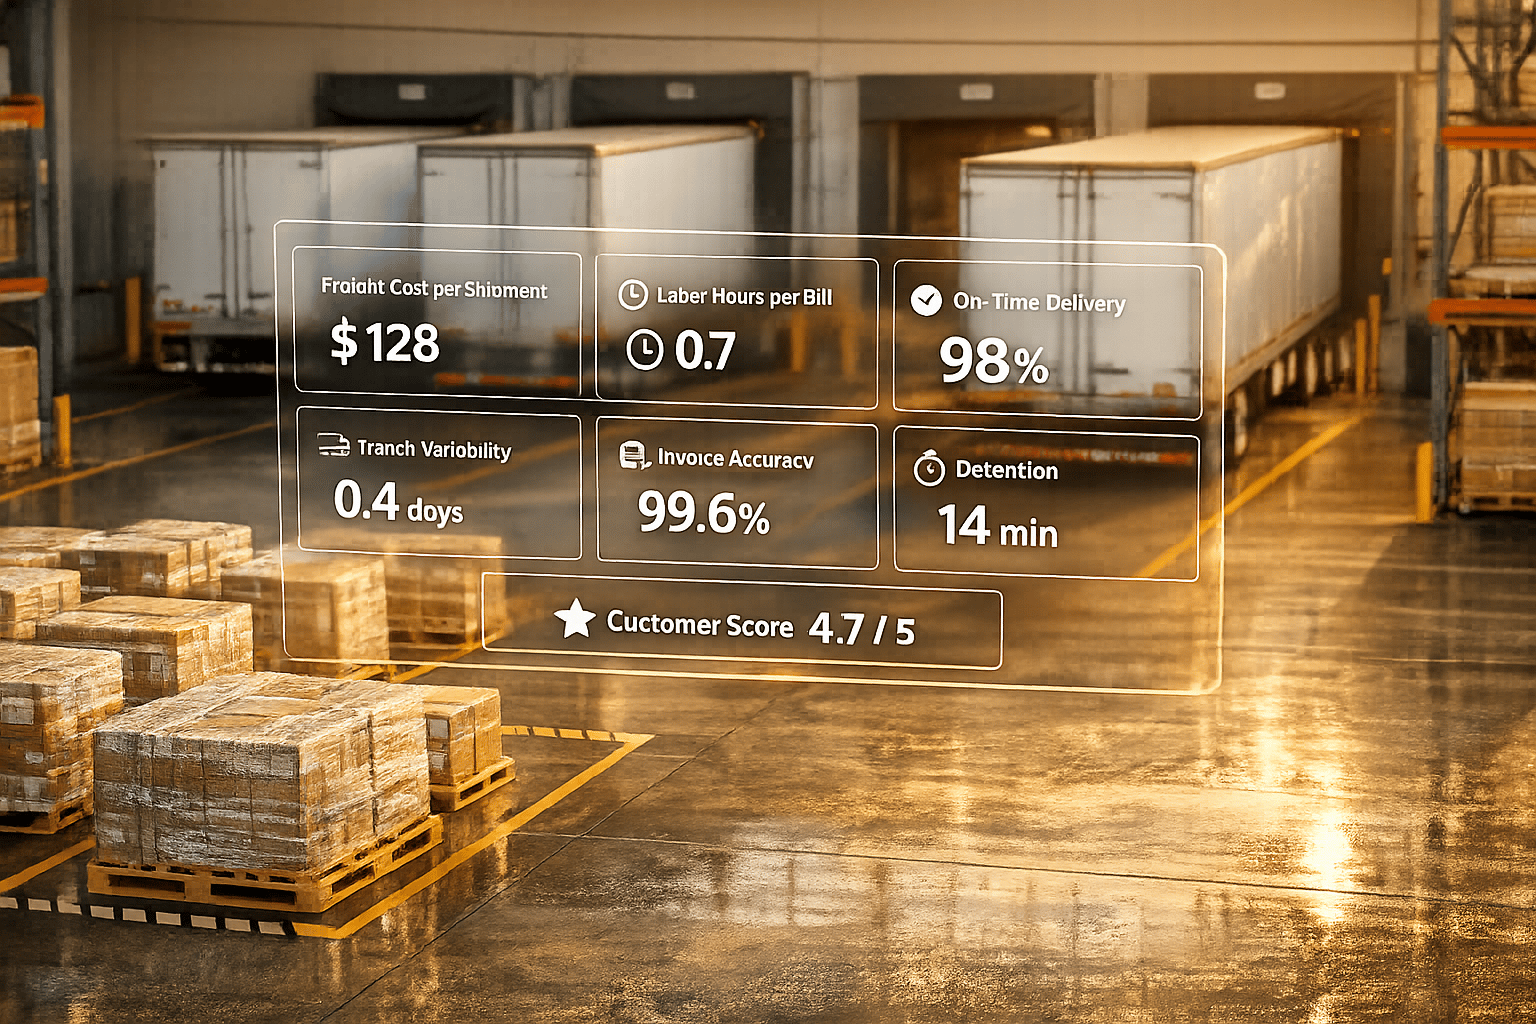
Investing in LTL automation can save time, reduce costs, and improve delivery accuracy. But to measure its ROI effectively, you need to track specific metrics. Here’s a quick breakdown of the key areas:
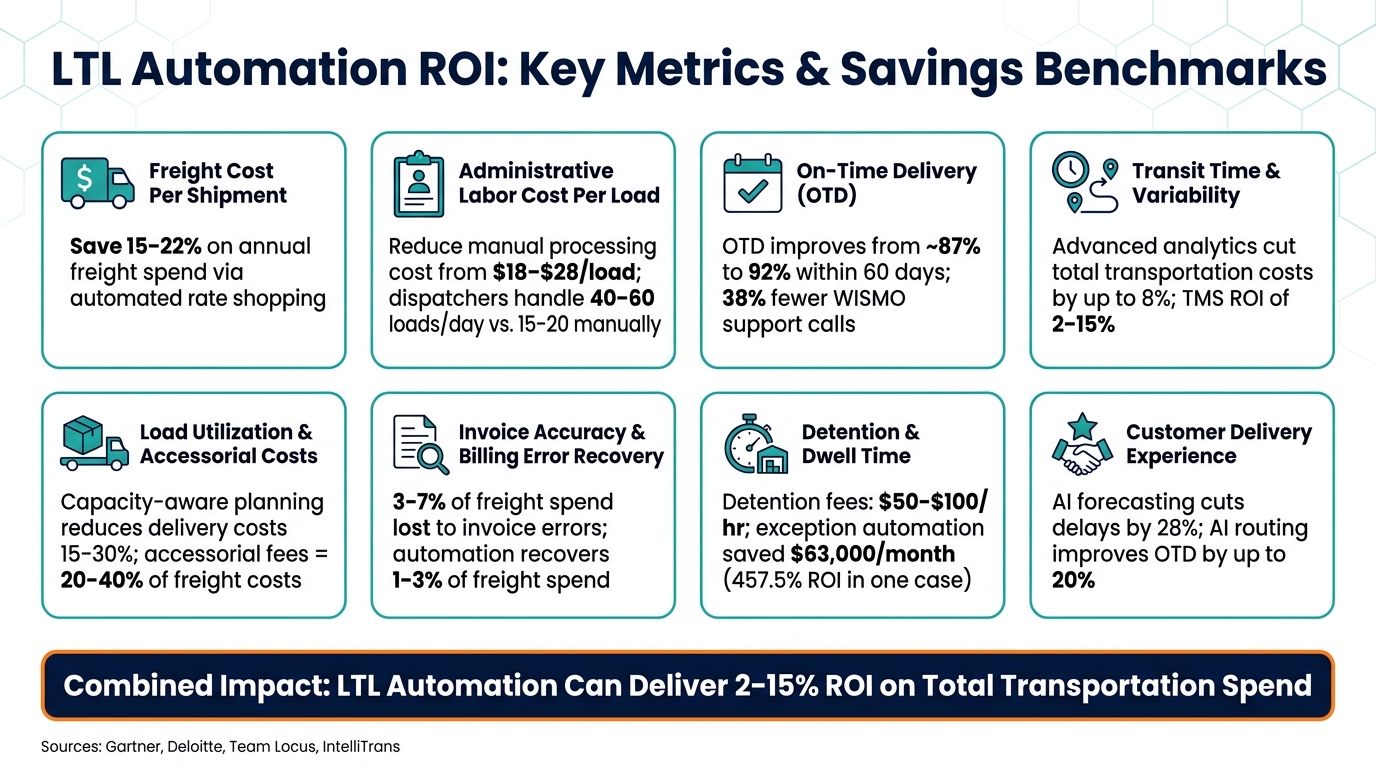
- Freight Cost Per Shipment: Automation can cut freight spend by 15–22% through rate shopping and hidden fee identification.
- Administrative Labor Cost Per Load: Automating manual tasks reduces labor costs, saving time and reallocating resources.
- On-Time Delivery (OTD): AI-driven tracking improves OTD rates, reducing re-delivery costs and customer complaints.
- Transit Time and Variability: Consistent transit times lower inventory and staffing costs, while automation flags delays early.
- Load Utilization and Accessorial Costs: Optimized planning reduces underutilized space, while hidden fees are minimized upfront.
- Invoice Accuracy: Automated audits catch billing errors, recovering 1–3% of freight spend.
- Detention and Dwell Time: Real-time tracking reduces penalties and improves scheduling.
- Customer Delivery Experience: Tools like real-time tracking and automated updates enhance customer satisfaction and retention.
1. Freight Cost Per Shipment
Freight cost per shipment is a straightforward way to measure the ROI of LTL automation. By dividing the total freight spend by the number of shipments over a set period, you can compare costs before and after automation to provide clear data for decision-makers.
One of the biggest advantages of automation is automated rate shopping, which eliminates the need to manually contact multiple carriers. This efficiency can save mid-size shippers between 15% and 22% of their annual freight spend [8]. Automated systems can query over 30 carrier APIs in less than a minute - a process that would otherwise take 45 to 90 minutes manually [8]. Gartner highlights this potential, stating:
“Automation capabilities could generate an ROI of between 1% and 3% on freight cost savings alone for your organization.” [1]
Take Halcyon Industrial as an example. In 2026, this $45M industrial distributor, managing 1,800 LTL and FTL shipments monthly, integrated their ERP with 32 carrier APIs. This reduced their rate comparison time from 15 hours per week to under 3 hours. The system also identified better price-service combinations that manual processes missed, leading to an average savings of 17% per shipment and approximately $340,000 in annual recovered spend [8].
Automation doesn’t just streamline rate shopping - it also flags hidden costs like liftgate fees, inside delivery charges, and fuel surcharges before they appear on invoices. By proactively addressing these charges during the quoting stage, companies can cut freight spend by an additional 5% to 15% [7].
To monitor this metric effectively, start with a 30-day pre-automation baseline. This should include total freight spend, average cost per shipment, and accessorial fees by lane. Platforms like ShipPeek LTL TMS simplify this process by consolidating rate requests, booking, and carrier data into one system. This makes it easy to generate consistent, side-by-side comparisons without juggling data from multiple carrier portals.
The next step? Evaluate administrative labor savings to get a fuller picture of LTL automation ROI.
2. Administrative Labor Cost Per Load
Administrative labor cost per load reflects the expense involved in managing a single shipment. This includes tasks like rate requests, generating bills of lading (BOL), making status calls, preparing invoices, and managing related documents.
To calculate this cost accurately, consider the full labor expense. This means accounting for not just salaries but also benefits, taxes, and overhead. For example, a logistics coordinator earning $60,000 annually would have an hourly cost of about $42–$47 when all factors are included [9]. Multiply this hourly rate by the average time spent on each load to determine the actual cost.
Deloitte provides a useful benchmark:
“The average regional freight broker spends $18–$28 per load on manual administrative processing - status calls, shipper notifications, invoice preparation, and document management.” [10]
This highlights how automation can transform time-consuming processes. For instance, automation can cut invoice processing time from 15 minutes to just 2 minutes, while status tracking can become instantaneous [10]. Even more impressively, a single dispatcher who typically manages 15–20 loads daily could handle as many as 40–60 loads with the help of automation.
However, the benefits of saved time only translate into measurable returns if that time is used productively. To estimate the impact, apply a reallocation factor of 60–80%. For example, if a team saves 20 hours weekly, only 60–80% of that time might realistically go toward higher-value activities like handling exceptions or monitoring carriers [9].
Automation tools like ShipPeek LTL TMS simplify workflows by consolidating dispatch data, tracking, and carrier communications into a single platform. This eliminates the manual, time-draining “swivel-chair” processes that often slow down dispatchers.
Additionally, systematically capturing labor data - such as handling time per load, the frequency of human interventions, and exception rates - can provide managers with actionable insights. This information, often missing from standard profit and loss reports, can help pinpoint inefficiencies by lane, improve carrier choices, and amplify long-term returns [5].
3. On-Time Delivery Performance
On-time delivery (OTD) is a critical metric for evaluating the return on investment (ROI) of LTL automation, following labor and freight cost analysis. Many shippers relying on manual dispatch typically report OTD rates in the 80–90% range before automation [5]. However, with AI-driven tracking and automated exception management, results can improve quickly. For instance, one benchmark showed a jump from 87% to 92% within just 60 days of implementation [2]. These improvements directly cut down re-delivery costs.
Each failed delivery comes with a price tag - about $10–$17 in direct re-delivery costs [5]. And that doesn’t even include chargebacks, SLA penalties, or the extra labor needed to fix errors. Mistakes like incorrect addresses, documentation issues, or misrouted shipments can lead to significant expenses, sometimes stretching into thousands of dollars due to rework, delays, or penalties [4].
Automation flips the script, moving teams from reactive problem-solving to proactive management. With AI-driven tracking and predictive ETAs, potential issues are flagged before they escalate [2]. This doesn’t just mean fewer late shipments; it also reduces customer inquiries - automated tracking can cut these down by as much as 38% [5].
To measure these improvements, consistent data tracking is essential. Start by establishing a 30-day historical baseline for OTD performance [2]. Weekly monitoring can help spot service issues early and provide financial stakeholders with clear data to validate the investment. Tools like ShipPeek LTL TMS simplify this process by centralizing carrier data and shipment events into a single dashboard, eliminating the need for manual data pulls.
Another advantage is improved carrier accountability. Automated logging of delivery events makes it easier to identify underperforming carriers or lanes, enabling you to shift volume as needed [2]. Better OTD performance not only reduces extra costs but also boosts operational efficiency and customer satisfaction - key factors in any LTL automation ROI analysis.
Next, let’s look at average transit time and variability for more insights into ROI.
4. Average Transit Time and Variability
On-time delivery is essential for ensuring shipments arrive as promised, but understanding average transit time and its variability gives a deeper look into operational performance. These metrics reveal which carriers and routes maintain consistency and which ones might be causing unnecessary costs through delays, detention fees, or last-minute expediting.
The real challenge often lies in variability. A carrier consistently taking 3 days for a route isn’t a problem. But if that same carrier’s transit times fluctuate between 2 and 5 days, it creates operational headaches. Such inconsistency forces businesses to keep extra safety stock, adjust staffing schedules at receiving docks, and deal with the financial hit of missed delivery windows. As IntelliTrans Chief Product Officer Mayank Sharma explains:
“When carriers offer consistent performance, costs associated with late deliveries or penalties can be reduced.” [3]
In other words, high variability quietly drives up costs across the board.
For shippers leveraging advanced analytics, the rewards are clear. Enhanced visibility and proactive exception management can cut total transportation costs by up to 8% [2]. Transportation Management System (TMS) tools that optimize routing and scheduling can offer a return on investment (ROI) ranging from 2% to 15%, often within just a few months [2]. Even smaller gains can significantly impact the bottom line. But to measure these improvements, it’s crucial to start with a solid historical baseline.
Begin by auditing 6–12 months of transit data for each carrier and lane before rolling out automation [11]. This historical snapshot becomes critical for calculating ROI later. Once automation is implemented, monitor transit time variability weekly to spot performance declines early. Tools like ShipPeek LTL TMS simplify this process by consolidating carrier data into a single dashboard, eliminating the need to manually pull reports. This centralized view makes it easier to detect patterns and address issues as they arise.
When deviations occur, automated systems step in to manage them in real time. Team Locus provides a clear example:
“When a deviation occurs, such as a driver running 20 minutes late at stop four, the system flags it, recalculates ETAs for remaining stops, and pushes updated notifications to customers without requiring dispatcher input.” [5]
This proactive approach to managing transit variability ensures smoother operations and minimizes disruptions, delivering tangible benefits to overall efficiency.
5. Load Utilization and Accessorial Cost Impact
When analyzing ROI, it’s crucial to include load utilization and accessorial costs alongside freight and labor expenses. These two factors are often overlooked but can significantly impact budgets. As Team Locus highlights:
“Under-loaded vehicles are a hidden cost rarely appearing in a monthly P&L review.” [5]
Inefficient load utilization is a prime example. Operating vehicles at only 65% capacity means fleets are absorbing full fixed costs while wasting 35% of potential usage. Automated systems can address this by using capacity-aware planning - accounting for weight, volume, and equipment needs - which can reduce delivery costs by 15%–30% within the first year [5].
Accessorial charges are another major budget drain. Fees for services like liftgate use, residential delivery, inside delivery, and re-delivery often contribute to 20%–40% of total freight costs [8]. Worse, these charges frequently appear as unexpected post-shipment expenses. Solutions like ShipPeek LTL TMS tackle this by integrating accessorial terms into real-time API queries, ensuring these costs are included in the initial quote rather than as surprises later [12]. By proactively managing these hidden fees through digital tools, businesses can achieve a 5%–15% reduction in freight spend [7].
But the challenges don’t stop there - invoice errors can further inflate costs. Around 3%–7% of freight invoices contain errors, with most of these mistakes favoring carriers [11]. AI-powered auditing tools can validate invoices against contracted terms and historical data, recovering 1%–3% of total freight spend that might otherwise be lost [11]. For instance, a national retailer implementing AI-driven invoice auditing with their TMS and ERP reduced invoice errors by 80%, cut dispute resolution times from 30 days to under 7, and saved $400,000 annually [14].
To maximize the benefits of automation, start by auditing the past 12 months of invoices. Categorize accessorial charges by type and carrier to identify where the largest savings opportunities lie before implementing new systems [5] [11].
6. Invoice Accuracy and Billing Error Recovery
Did you know that LTL invoice errors can account for a staggering 30–40%, slashing profit margins by as much as 15–20%? [18] The main culprits? Accessorial overcharges, which make up about 40% of billing errors, and rate misapplications, responsible for roughly 25% [17]. Altogether, these mistakes can drain 3–7% of your annual freight spend [17].
Automating the invoice auditing process flips the script. Instead of reacting to errors after payments are made, automation enables proactive pre-payment validation, catching costly mistakes before they hit your bottom line [17]. To gauge the effectiveness of automation, keep an eye on these metrics:
- First-pass match rate: How often invoices pass initial checks without issues.
- Dispute rate per 1,000 invoices: A measure of how often billing discrepancies occur.
- Mean resolution time: The average time it takes to resolve disputes.
- Net recovered revenue: The total dollars saved or recovered through error detection.
These indicators not only highlight the savings from automation but also pinpoint inefficiencies in any remaining manual processes [16][13].
A clear audit trail is non-negotiable. Jordan Miles, Senior Editor & Automation Strategist, emphasizes its importance:
“Every automated decision must be logged with input documents, confidence scores, the model version, and user actions. This delivers an auditable trail for disputes and compliance reviews.” [15]
The benefits are clear. For example, in 2026, a mid-sized 3PL handling 12,000 LTL invoices monthly adopted a rules-based automation system with carrier EDI integration. Within six months, their dispute rate dropped from 18% to 6%, billing time shrank to just 12 hours, and their profit margins improved by 2.4 percentage points [16]. Similarly, Armstrong Transport Group experienced dramatic efficiency gains, as CFO Dave Morris shared:
“Workflow AI for LTL is a game changer for our back office, cutting invoice processing time by up to a week.” [18]
If you’re just starting out, the first step is to centralize your data. Combine sources like EDI 210 feeds, carrier portals, TMS exports, and scanned PDFs into a single, unified model. This creates a reliable foundation for audit logic and a defensible record for any disputed charges [13]. Tools like ShipPeek LTL TMS make this process even smoother, integrating data and ensuring accurate billing. These advancements not only improve invoice accuracy but also amplify the returns on your automation investment.
7. Detention, Dwell, and Exception Management
Detention and dwell costs can quietly drain your freight budget - until they don’t, and the numbers start to spike. Dwell time refers to the total time a truck spends at your facility, from arrival to departure. Detention, however, kicks in when that time exceeds the carrier’s free window, which is usually two hours. After that, you’re looking at penalty fees in the range of $50 to $100 per hour [19]. These costs can pile up fast if left unchecked.
The first step to controlling these expenses is tracking. By measuring median dwell time across facilities, lanes, and carriers, you can pinpoint where bottlenecks are happening. Are trucks waiting because shipments aren’t staged in advance? Is one facility consistently running behind schedule? Manual tracking won’t uncover these patterns, but automated tools - like GPS, geofences, or dock-occupancy sensors - can. With this data, you can take targeted action. A practical goal? Aim for a 20% reduction in median dwell time by using automated appointment systems [20].
“Automation wins in logistics when it cuts empty miles, reduces dwell time, and makes ETAs honest.” - Yury Shamrei, CEO & Founder, SumatoSoft [20]
The same principles apply to exception management. An exception is any unplanned event - like a GPS signal dropout, a late pickup, or a mis-sorted shipment - that disrupts on-time delivery. Without automation, these issues are often noticed too late, usually after detention fees have already kicked in. Modern TMS platforms and AIoT tools can send real-time alerts the moment an exception occurs, giving your team a chance to act before minor delays spiral into major costs [20]. In fact, advanced analytics for exception management can help trim transportation costs by up to 8% [2].
Here’s a real-world example: A TMS team implemented a micro app in 2025–2026 to automatically classify freight exceptions across 120,000 monthly transactions. Their error rate dropped from 600 to 180 in the first month. At an average cost of $150 per error, that’s 420 fewer mistakes - saving $63,000 per month and achieving a 457.5% ROI [4].
To make these insights actionable, focus on your most frequent exception types. Turn them into specific dashboard views to identify recurring issues. This approach reveals the process or policy gaps causing these problems, giving you a clear path to fix them [16]. By addressing hidden costs like detention and accessorial fees through digital solutions, businesses can see a 5–15% reduction in overall freight spend [7].
8. Customer Delivery Experience Metrics
Shipping performance isn’t just about costs - it directly influences whether your customers stick around. Every delay, billing issue, or missed delivery window chips away at trust. And in the B2B LTL space, where buyers now expect “Amazon-level” transparency, regaining that trust is no easy task once it’s lost [6].
To understand and improve the customer experience, you need to track specific metrics. Key indicators like Customer Satisfaction Score (CSAT), complaint rate, repeat order rate, and the Perfect Order Rate (the percentage of shipments delivered on time, in full, and error-free) are crucial. These aren’t just feel-good numbers - they directly impact revenue. For example, AI-driven forecasting systems can cut delays by an average of 28%, leading to measurable improvements in customer retention [6]. Similarly, companies using AI-powered routing have improved on-time delivery rates by as much as 20% compared to manual planning [6]. Together, these metrics round out the financial, operational, and customer experience KPIs needed for a full LTL automation ROI analysis.
One of the most visible signs of automation’s impact is the reduction in WISMO (“Where Is My Order”) inquiries. When customers have access to real-time tracking through a TMS or customer portal, they don’t need to call for updates. For instance, Locus reported a 38% drop in inbound WISMO support calls after implementing automated ETA updates in high-volume operations. This not only cuts down on support costs but also boosts customer satisfaction and operational efficiency [5].
Automation also transforms billing processes. A mid-sized 3PL handling 12,000 LTL invoices per month reduced its invoice dispute rate from 18% to 6% in just six months by using a rules-based automation system with integrated EDI. This also slashed their time-to-bill from 4 days to just 12 hours, significantly improving customer satisfaction [16]. Fewer billing errors mean fewer unhappy customers.
Practical ROI Tracking and Reporting
Tracking individual metrics is helpful, but it’s not enough. The real challenge is piecing everything together into a single, unified view that shows what’s working and what isn’t. A modern TMS (Transportation Management System) can serve as your single source of truth, integrating data from your ERP, WMS, and carrier systems through API and EDI connections [21][7]. For instance, platforms like ShipPeek LTL TMS are designed to consolidate rate requests, bookings, and tracking data across multiple carriers. This eliminates the need for your team to juggle spreadsheets or switch between carrier portals to get a full picture.
Before you can measure any improvements, you need a solid starting point. Gather at least 12 months of historical data that includes total freight spend, average shipment costs, manual touchpoints, and exception rates [5]. This “before” snapshot is critical - it gives your ROI calculations credibility when presenting them to finance teams or leadership. Without it, your ROI claims might lack the necessary weight.
Once your automation is live, it’s important not to assume you’ve achieved the full savings right away. Gartner highlights that TMS solutions with optimization features can deliver between 2% and 15% ROI on transportation spend, but savings often appear in stages [2]. As Team Locus explains:
“A CFO evaluating the investment at month six sees a fraction of the eventual return and may conclude the investment is underperforming, when in fact the more valuable savings categories have not yet had time to materialize.” [5]
To account for this delay, use a staggered reporting schedule. This approach helps track progress over time and ensures you’re capturing the full picture. Here’s how to structure your reporting:
| Reporting Cadence | Focus Metrics | Purpose |
|---|---|---|
| Weekly | Freight spend vs. baseline, on-time delivery (OTD) %, manual touchpoints | Identify early adoption issues |
| Monthly | Average cost per load, admin hours saved, load utilization | Adjust carrier mix and lane strategies |
| Quarterly | Annualized savings (USD), SLA compliance, customer churn | Build the case for ongoing investment |
To translate time savings into dollar amounts, multiply the hours saved by the average hourly wage. For example, saving 60 hours per month at $40/hour equals $2,400 per month, or $28,800 annually [2]. Then, calculate your monthly net benefit - combining labor savings and avoided costs, minus automation fees - and multiply that by 12 to get the annualized figure in dollars [4].
When presenting ROI, offer three scenarios: conservative (50% of benchmarks), moderate (75%), and aggressive (100%+). This gives decision-makers a range of outcomes to consider, making your case harder to dispute [5]. By following this phased and structured approach, you not only build a strong ROI narrative but also ensure consistent performance tracking over time.
Conclusion
Tracking the return on investment (ROI) for LTL automation isn’t a one-and-done task - it requires ongoing attention. The metrics discussed here, like freight cost per shipment and customer delivery experience, each play a role in uncovering valuable insights. Together, they paint a clear picture of how automation impacts your bottom line.
One of the biggest transformations brought by automation is shifting from reactive problem-solving to proactive planning. By keeping a close eye on the right data, you can tackle issues before they escalate - whether it’s identifying an underperforming carrier on a key route or catching billing errors that quietly eat into your profits. But these benefits only materialize when you actively monitor and act on the data your systems provide. This level of visibility lays the groundwork for using advanced tools to sustain and build on these improvements.
For example, ShipPeek LTL TMS offers a solution by pulling live contract rates directly from carrier APIs, addressing billing discrepancies that impact 15–30% of LTL shipments [12]. With unified tracking spanning over 100 carriers, it empowers logistics managers to make smarter decisions without the hassle of manual processes.
Ultimately, the metrics you track today are the stepping stones to better negotiations, more efficient operations, and stronger customer relationships. That’s how LTL automation evolves from a simple expense to a powerful edge in a competitive market.
FAQs
How do I set a baseline before LTL automation?
To get started with LTL automation, it’s crucial to first analyze your freight spend data from the last 6–12 months. Break this data down by shipping modes - such as FTL (Full Truckload), LTL (Less-than-Truckload), intermodal, or parcel shipping. This step helps you pinpoint your current costs and performance metrics. By doing so, you’ll establish a solid reference point to track improvements and measure ROI once automation is in place.
Which metrics prove ROI fastest after go-live?
Metrics that show ROI soon after go-live focus on early cost savings and efficiency gains. Key indicators to watch in the first 30 to 60 days include: - Lower freight costs: Automation often streamlines processes, leading to noticeable savings in shipping expenses. - Reduced manual work hours: By cutting down on repetitive tasks, businesses can free up valuable employee time. - Fewer operational errors: Automation minimizes mistakes, improving overall accuracy and reducing costly corrections. Most organizations achieve full ROI within 2 to 4 months, as these early wins highlight the immediate impact of automation.
How do I turn time saved into dollar savings?
To figure out how much money time savings translate to, start by calculating the hours automation cuts from tasks and multiply that by the employee's hourly pay. For example, if a task that used to take 2 hours now only takes 30 minutes, you've saved 1.5 hours. Multiply that by the hourly wage to see the dollar value of the time saved. But that's not all. You should also consider the impact of fewer errors and increased productivity. These improvements often mean lower costs from mistakes and smoother, more efficient operations overall.